Geez, leave it to Patrick Brosset to talk CSS performance in the most approachable and practical way possible. Not that CSS is always what’s gunking up the speed, or even the lowest hanging fruit when it comes to improving performance.
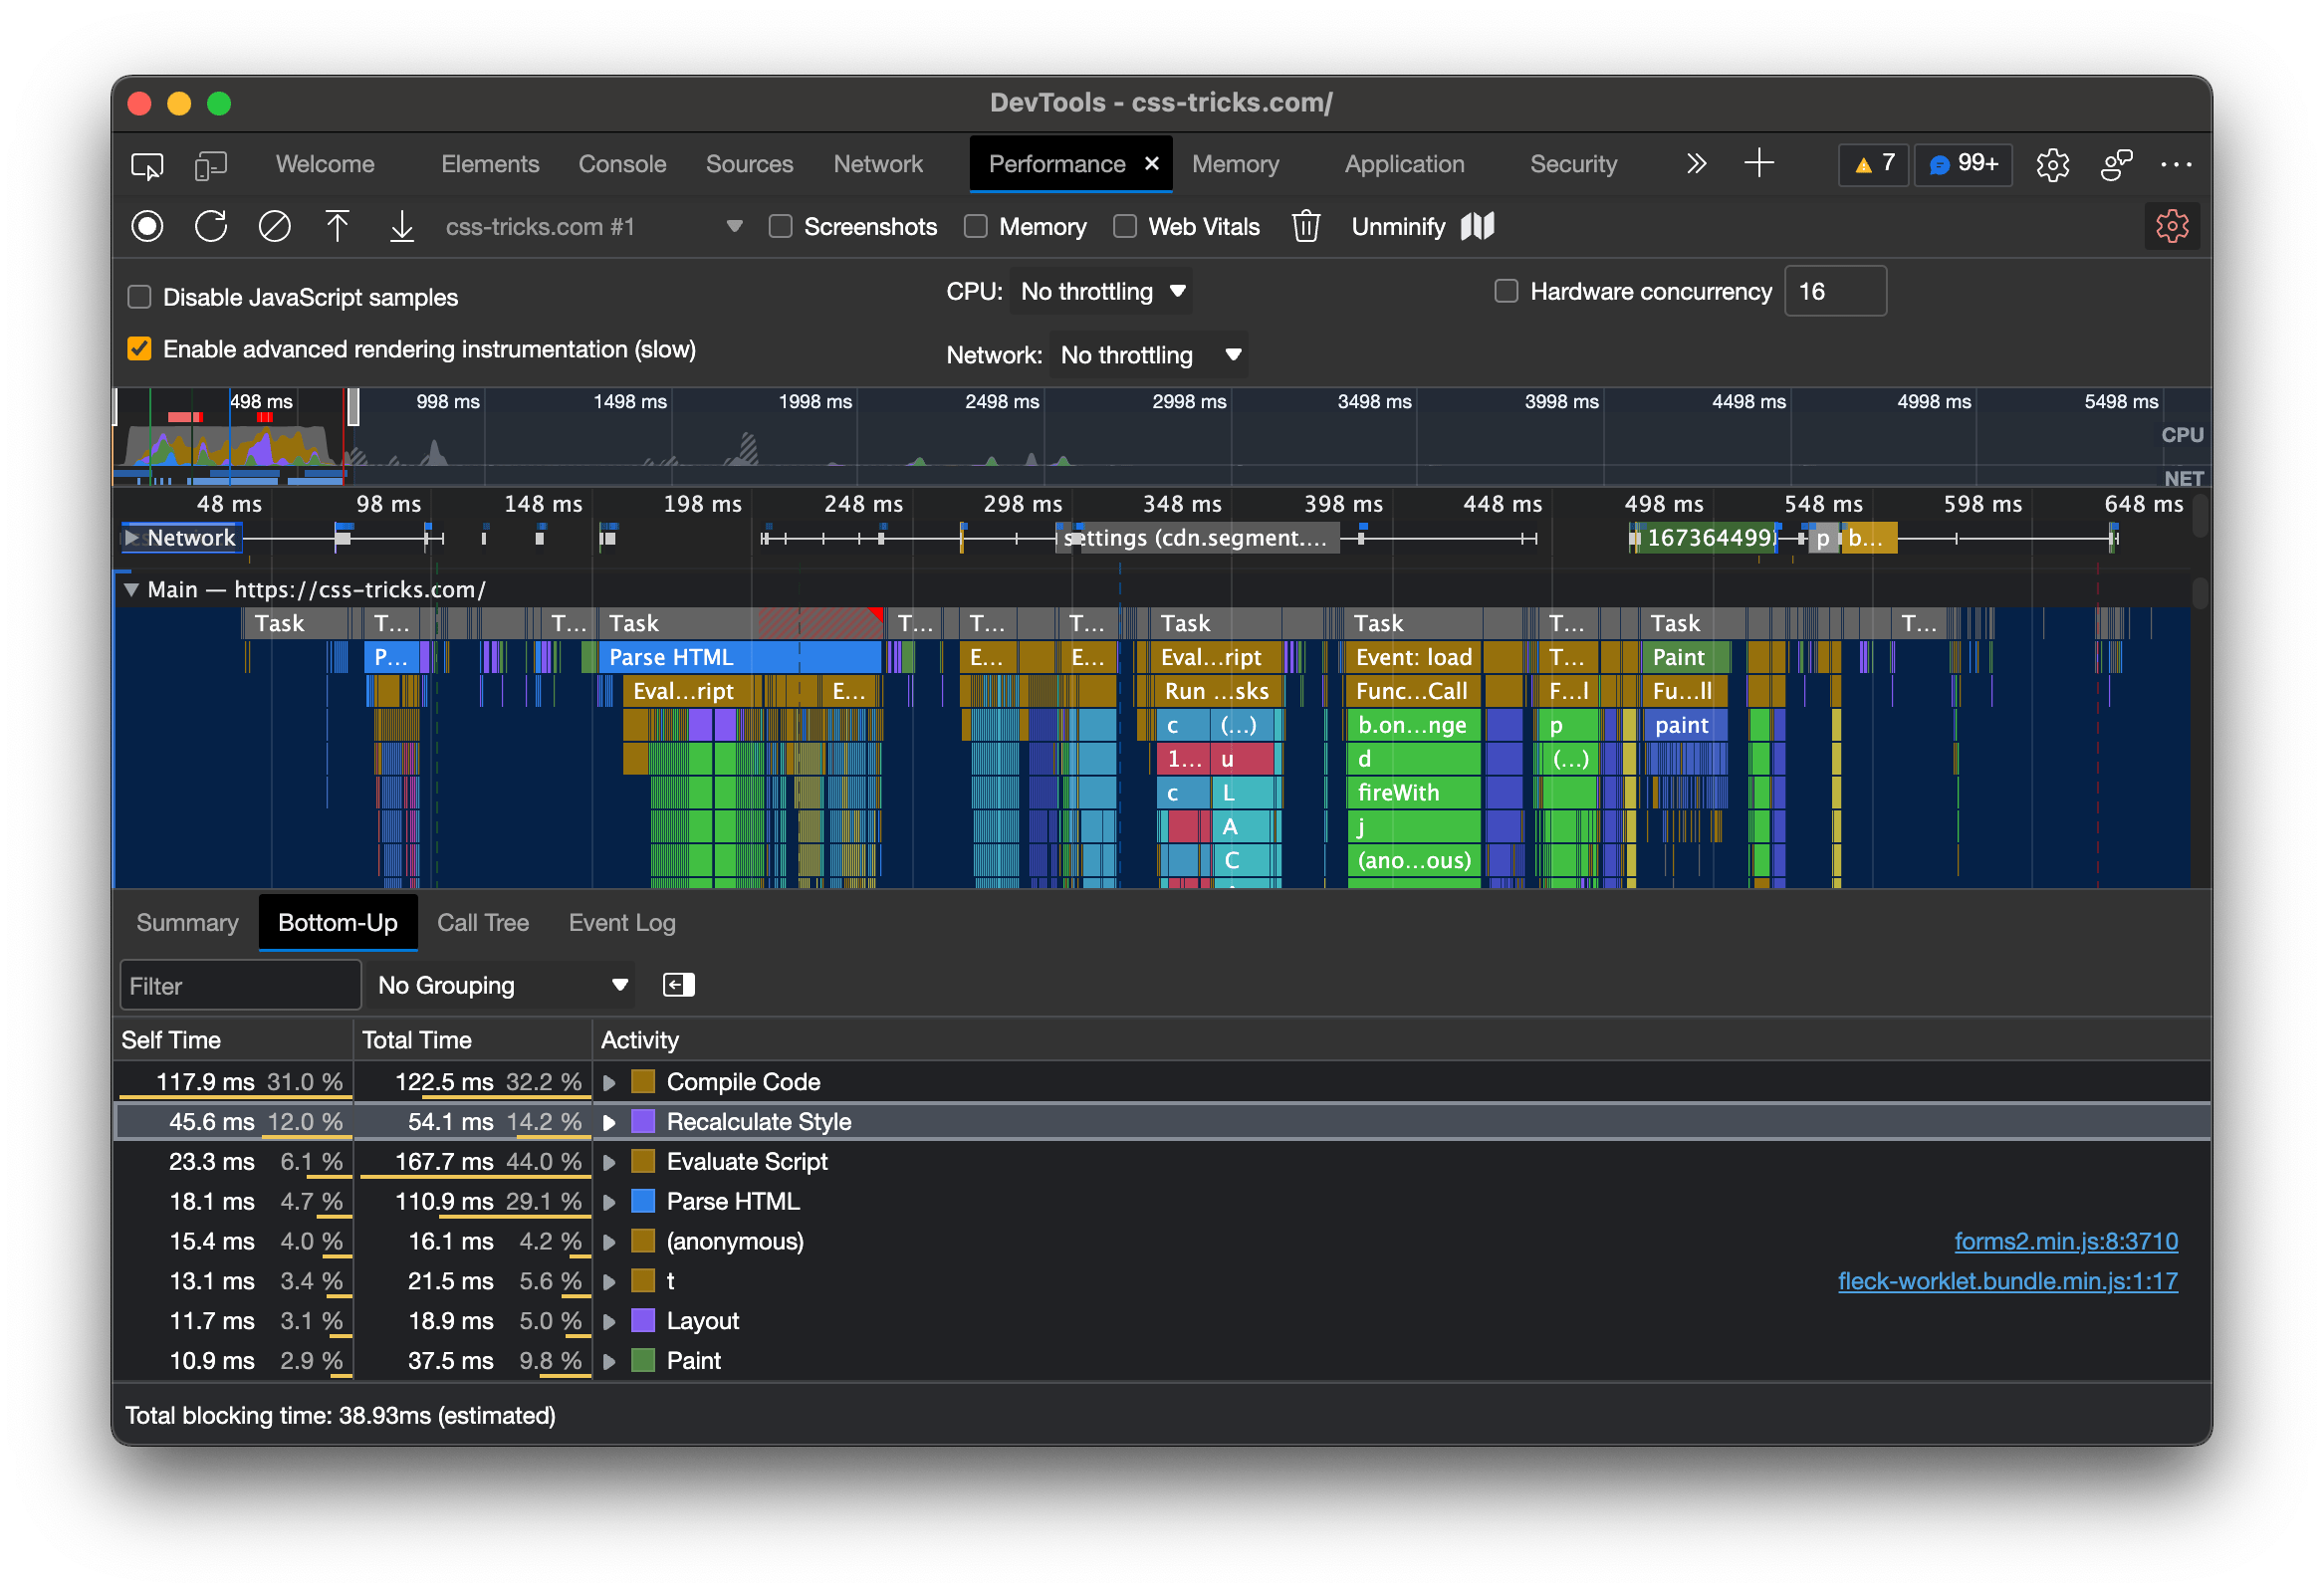
But if you’re looking for gains on the CSS side of things, Patrick has a nice way of sniffing out your most expensive selectors using Edge DevTools:
- Crack open DevTools.
- Head to the Performance Tab.
- Make sure you have the “Enable advanced rendering instrumentation” option enabled. This tripped me up in the process.
- Record a page load.
- Open up the “Bottom-Up” tab in the report.
- Check out your the size of your recalculated styles.

From here, click on one of the Recalculated Style events in the Main waterfall view and you’ll get a new “Selector Stats” tab. Look at all that gooey goodness!

Now you see all of the selectors that were processed and they can be sorted by how long they took, how many times they matched, the number of matching attempts, and something called “fast reject count” which I learned is the number of elements that were easy and quick to eliminate from matching.
A lot of insights here if CSS is really the bottleneck that needs investigating. But read Patrick’s full post over on the Microsoft Edge Blog because he goes much deeper into the why’s and how’s, and walks through an entire case study.